SEO + AEO Case Study · Dubai
Stone Art Hub:
Search Growth
Backed by Real Data
Formerly SAH Estate LLC
Connecting Dubai’s searches for stone, marble and fountains with pages built around what buyers need. Explore the search visibility, website audience and quote entries documented in the client’s original reports.
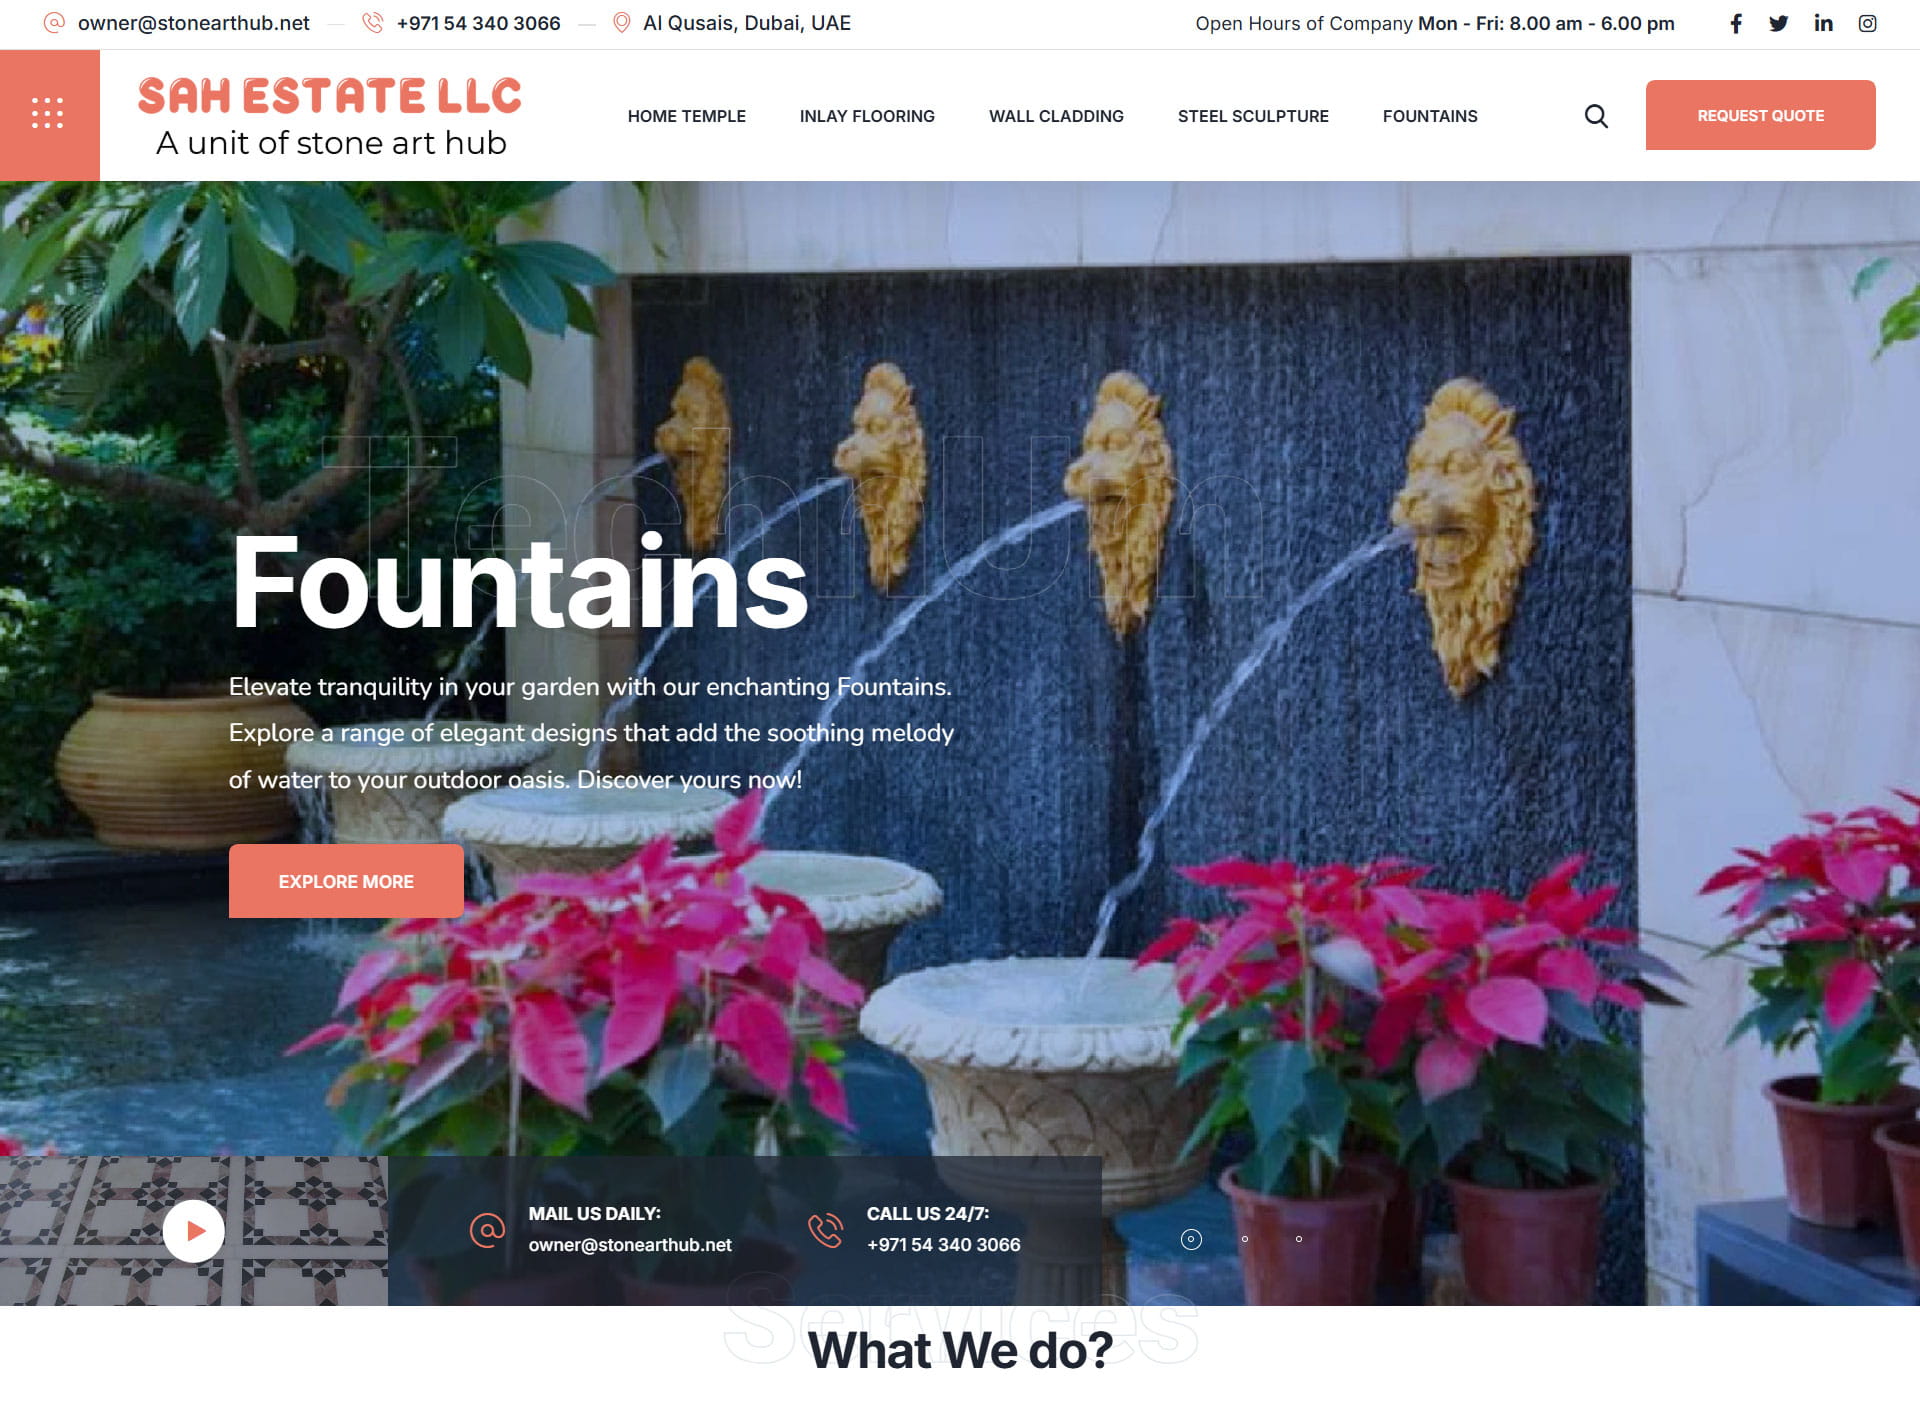
Natural stone, architectural surfaces and water features.
01 / The challenge
One specialist business.
Many ways to search.
A buyer looking for marble inlay flooring has different questions from someone specifying a fountain or comparing wall cladding. Stone Art Hub’s opportunity was to make these distinct services easy to discover, understand and enquire about.
The project record describes service-led landing pages, broader topic coverage and clearer enquiry paths. The reports below show activity across those specialist pages, rather than a property-sales business.
02 / Our two-year SEO + AEO approach
Build around buyer intent.
Measure what happens next.
The engagement lasted two years, as confirmed by the project owner. The reporting windows below cover different parts of that work.
Research & service structure
The project record maps service and location intent to focused landing pages for Dubai buyers.
Useful specialist content
Pages cover fountains, wall cladding, marble inlay and related products. Dated content records support ongoing topic work.
On-page SEO & internal links
Search intent, page relevance and enquiry paths form the documented strategy. Search Console records the internal link network.
Answer-ready information
AEO forms part of the owner-confirmed scope, with clear service information and buyer questions. No AI-traffic result is claimed.
Measure & refine
Search Console, GA4 and form records connect visibility, content use and enquiry capture, each within its own measurement limits.
Evidence basis: existing project notes, dated SEO/content records, client service pages and original reports. The available materials do not establish an item-by-item technical change log.
03 / Results & evidence
The numbers.
The reports behind them.
Original reporting, with a clear scope for every result. Select any screenshot to inspect its full-size, privacy-safe crop.
| Workstream | Measured result | Original evidence | Report period / interpretation |
|---|---|---|---|
| 01Search visibilityGoogle Search Console | 4.06Kclicks253KimpressionsCTR 1.6% · Average position 25.4 |
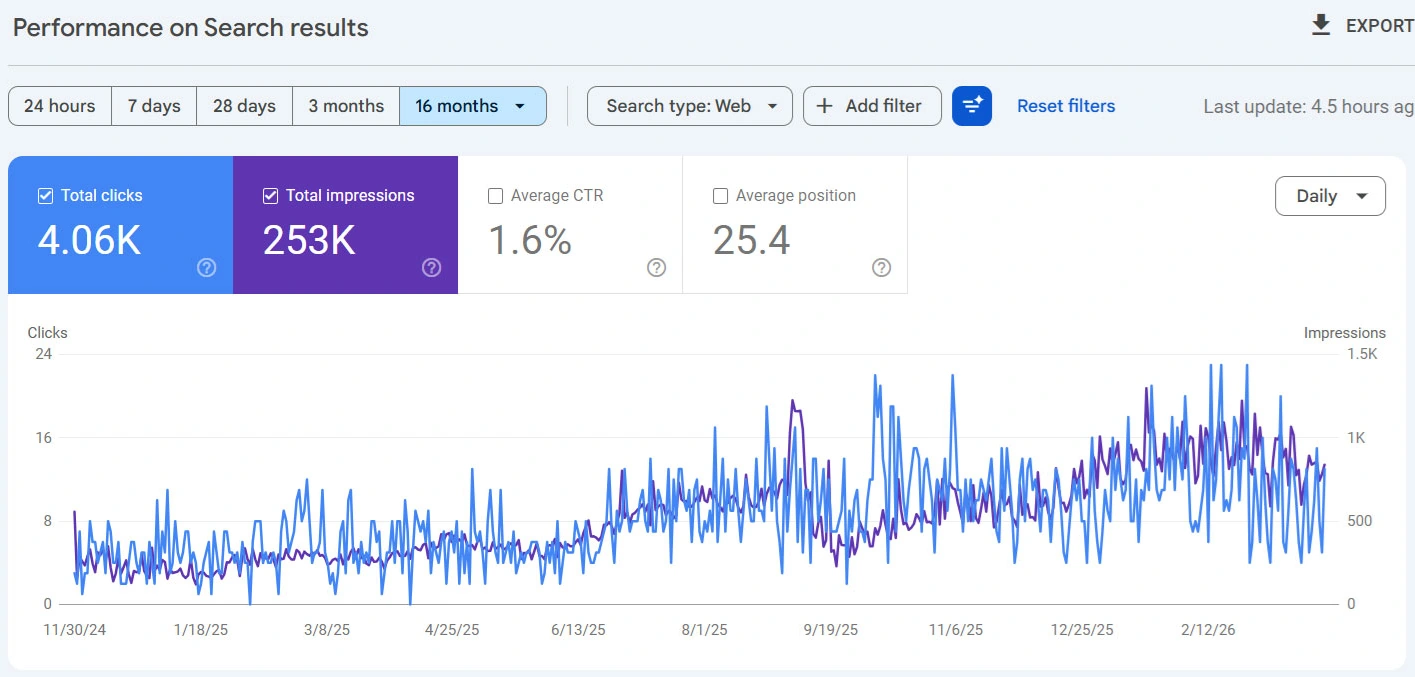 Inspect original report ↗ Inspect original report ↗ | 16-month selection Web search · stonearthub.ae. The chart starts at 30 Nov 2024; 12 Feb 2026 is its last labelled tick. The exact end date is not displayed. Impressions count search appearances, not unique people. |
| 02Website audienceGoogle Analytics 4 | 7,816active users |
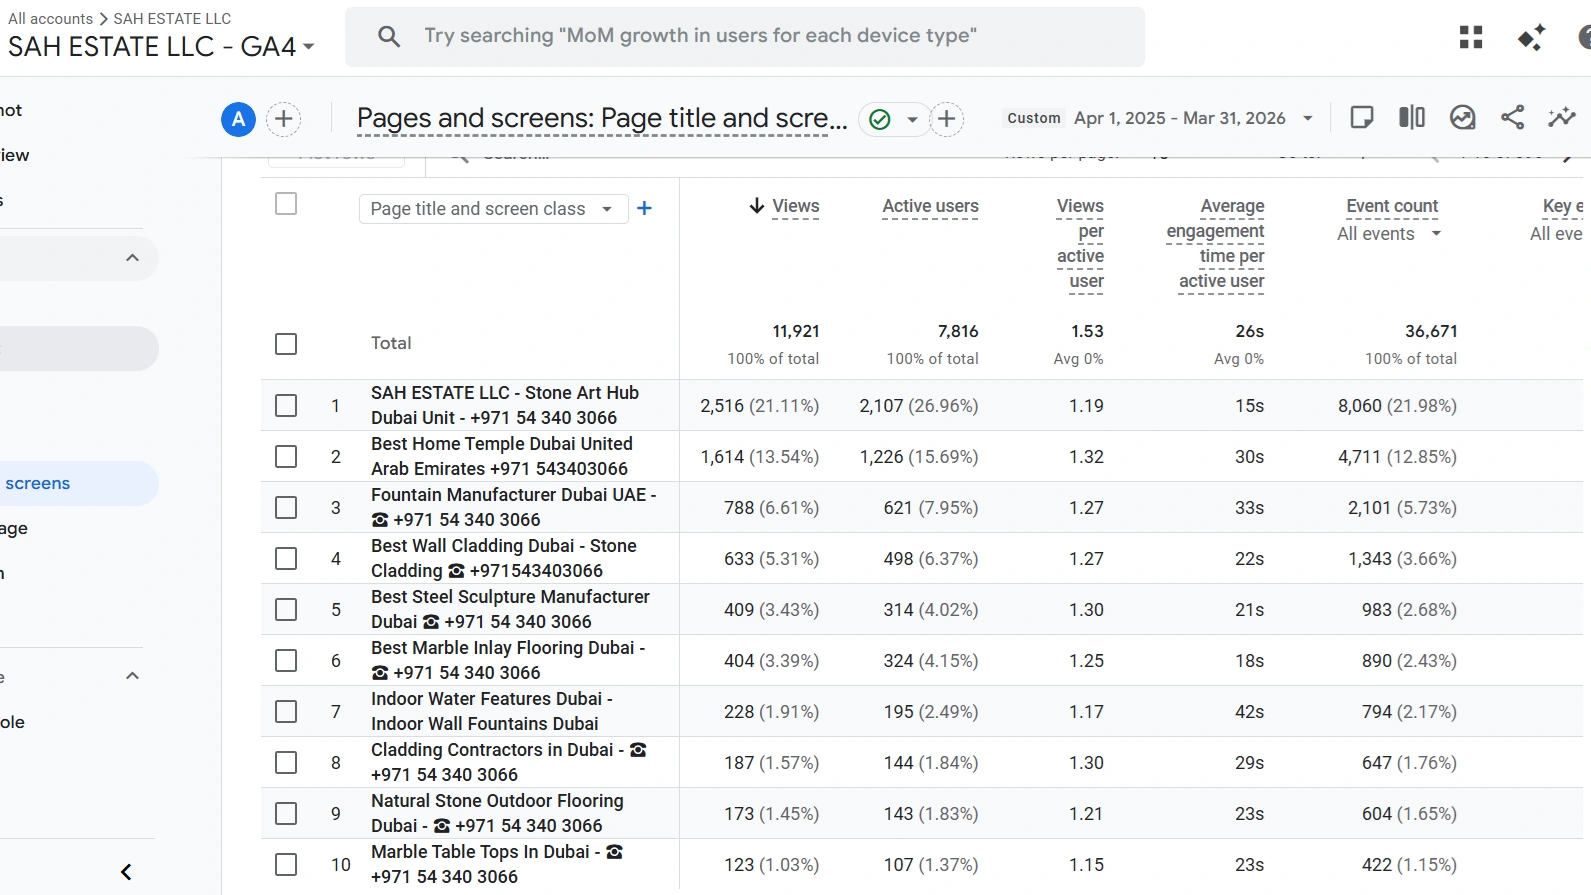 Inspect original report ↗ Inspect original report ↗ | 1 Apr 2025–31 Mar 2026 SAH ESTATE LLC – GA4, Pages and screens. Total website audience across the report. No organic-only channel filter is shown. |
| 03Enquiry captureWPForms | 889form entries“Get a Free Quote” |
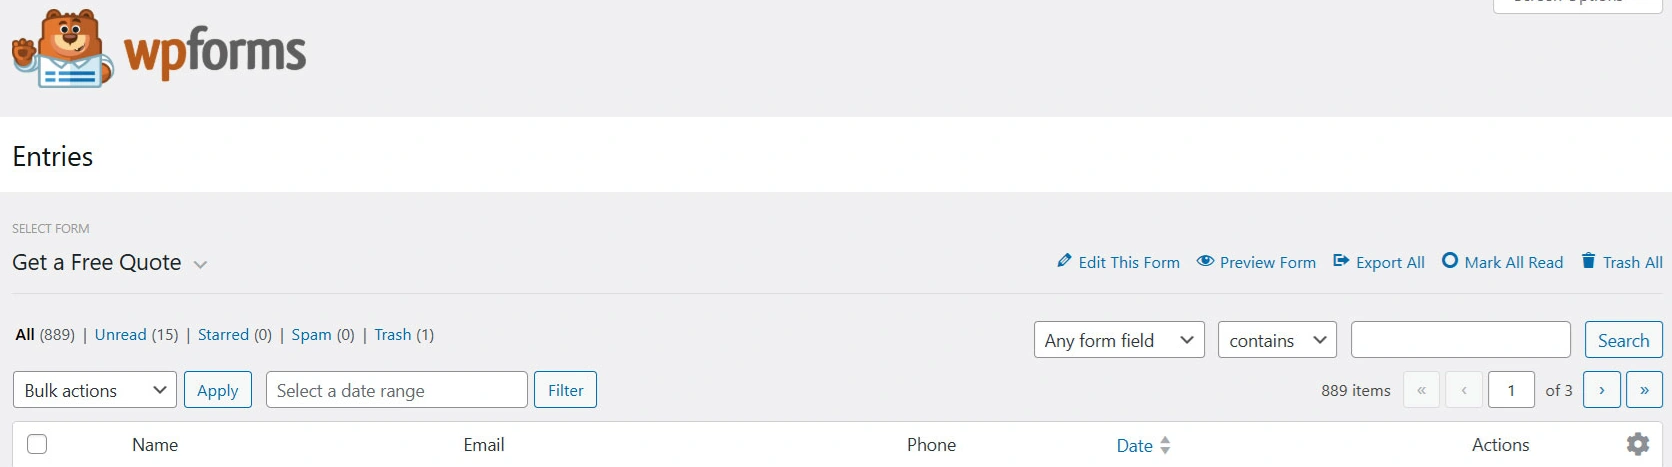 Inspect original report ↗ Inspect original report ↗ | Total entries shown No date range is selected. The report proves stored form entries; it does not establish lead quality, unique customers or organic attribution. All customer rows permanently removed from this image. |
| 04Site architectureGoogle Search Console | 2,543internal links |
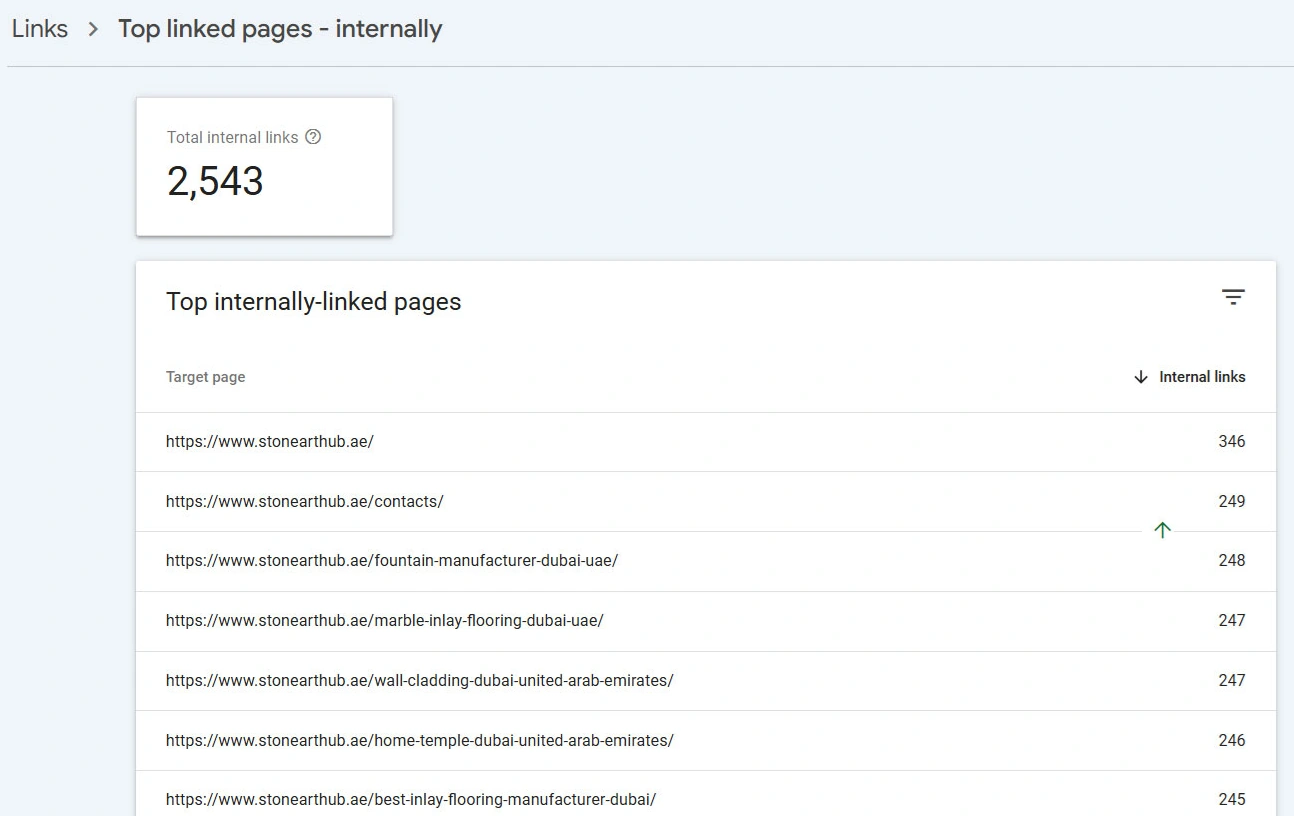 Inspect original report ↗ Inspect original report ↗ | Links report snapshot Top linked pages – internally. The screenshot has no date range and records links, not the number of published pages. |
| 05Content engagementGoogle Analytics 4 | 11,921page views26s average engagement time per active user · 36,671 events |
Inspect original report ↗ | 1 Apr 2025–31 Mar 2026 Pages and screens report. Views include repeat visits to pages; events include interactions beyond enquiries. |
How to read these results
These reports measure different things over different windows. They should not be added together or used to calculate an organic lead conversion rate. The supplied “1,000+ keywords” images show aggregate clicks and impressions, not a counted query export. A total of 1,000+ ranking keywords, 900+ organic enquiries, 200+ published landing pages and 2,000+ words per page has therefore not been presented as a verified result.
04 / What this means for a buyer
Help the right visitor
find the right next step.
For a stone and architectural-products business, the journey can begin with a specific material, installation or application. Relevant service pages give that visitor a place to evaluate the offer before requesting a quote.
Be discoverable for a relevant product or service.
Give buyers a dedicated page for their requirement.
Make a quote request easy to find and complete.
Specialist pages visible in the original reports
05 / A closer look
Visibility developed
across the reporting periods.
Two original views of search performance. The chart values remain exactly as captured in Search Console.
Inspect original report ↗The longer view
The 16-month graph shows higher search activity toward the later part of the period. It is an observed trend, with no claim that every change came from one intervention.
 Inspect original report ↗
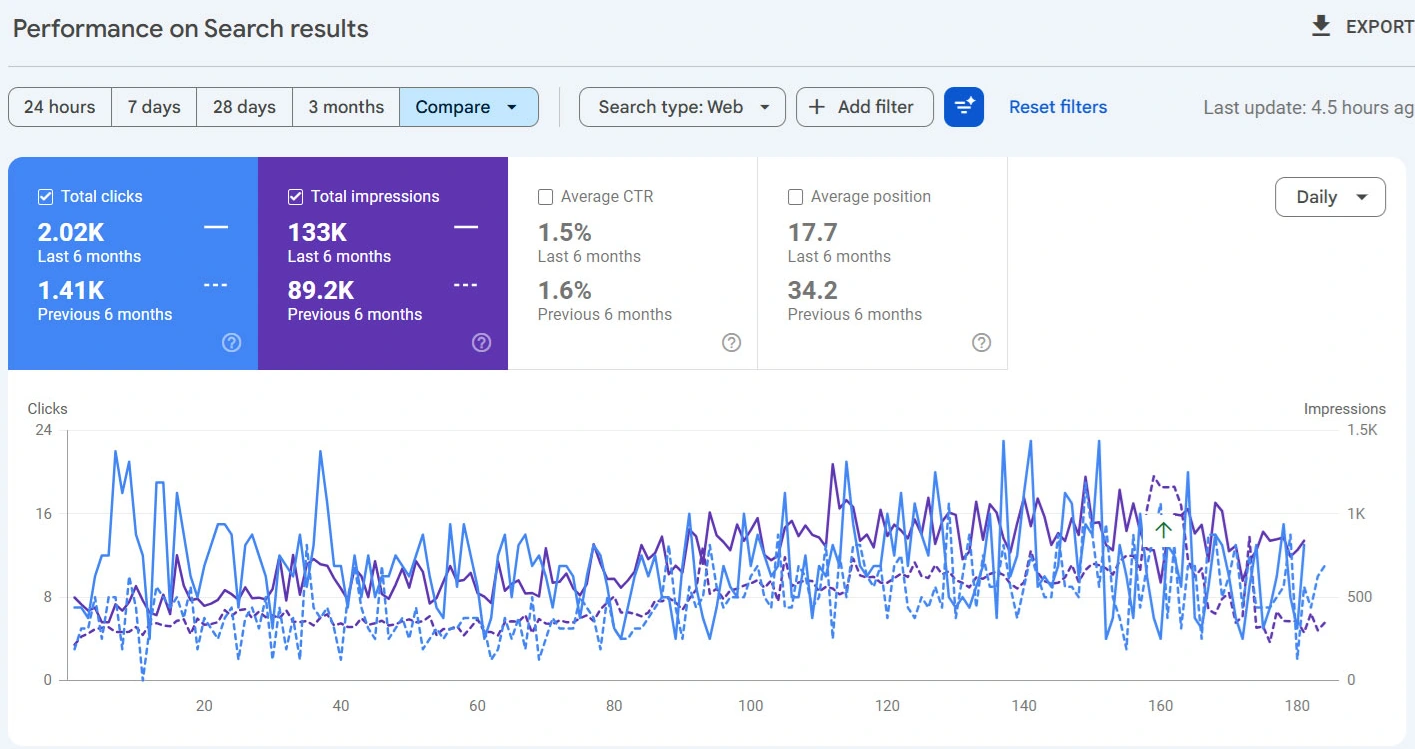
Six months compared with six months
The selected comparison shows 2.02K versus 1.41K clicks, and 133K versus 89.2K impressions. Average position is 17.7 versus 34.2. Exact date boundaries are not displayed.
Build your next chapter
Make your expertise
easier to discover.
Get an SEO + AEO audit shaped around your services, your market and the questions your next customer is asking.
Start with a practical review of your website.